Days Since Incident
Live counters for days since the last earthquake, eruption and more.
- 30 seconds
- Works on phones
- Alive
31 sites · every link checked daily
A good chart can change your mind faster than a paragraph. The data visualization websites in this category take that seriously, turning numbers into maps, timelines, tickers and animations that you can poke at.
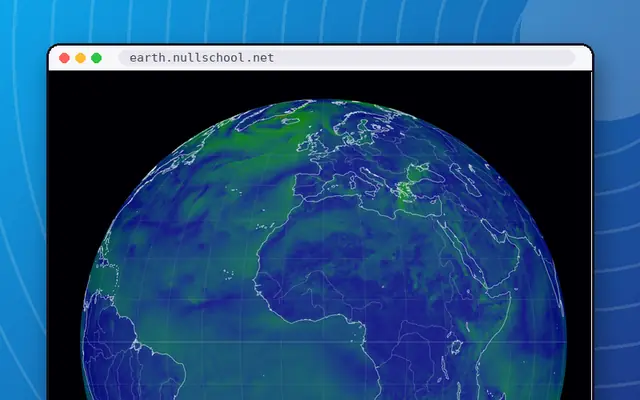
Open earth and you are looking at a spinning globe of live wind, weather and ocean currents, updated from forecast data. Gapminder Tools animates global statistics so you can watch countries move through time. Our World in Data is a serious research publication full of explorable charts, and a decent antidote to doom-scrolling. The Pudding tells one-off visual stories about culture. And for pure mesmerism, Worldometer fills a wall with live-ticking counters for population, births and more.
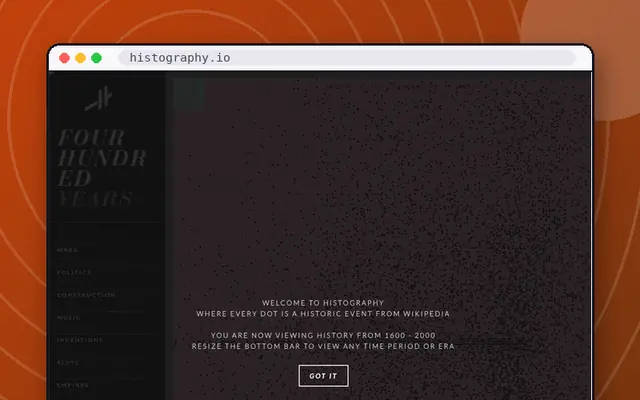
Not every entry is grave. Histography turns Wikipedia events into a dot-filled timeline from the Big Bang to today, and Google Ngram Viewer lets you chart a word through centuries of books and then argue about the result.
A quick caution: live counters like Internet Live Stats are estimates, and we say so rather than pretend otherwise. We favor sites that show their sources and let you explore.
Pair this category with Maps & Geography for the spatial side, or Science & Space for live skies and storms. The interesting websites list mixes data stories with other curiosities, and the button is always up for a surprise.
Live counters for days since the last earthquake, eruption and more.
Animated bubble charts that bust myths about the world.
Watch lightning strike around the world in near real time.
Chart how often any word appears in millions of books.
A gorgeous live globe of the world's winds, weather and ocean currents.
Charts on how the world is changing, with the data behind them.
Animated wind, wave and storm maps with a huge layer menu.
Real-time counts of emails sent, tweets posted and sites online.
Visual essays that explain culture with data.
Real-time counters for population, births, deaths and more.
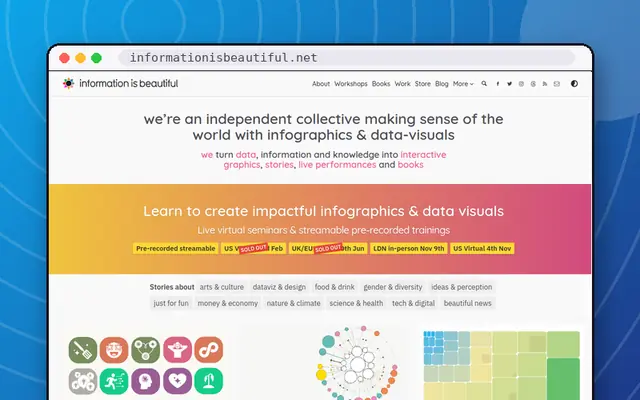
David McCandless's gorgeous data visualisations.
A live map of every notable earthquake on Earth.
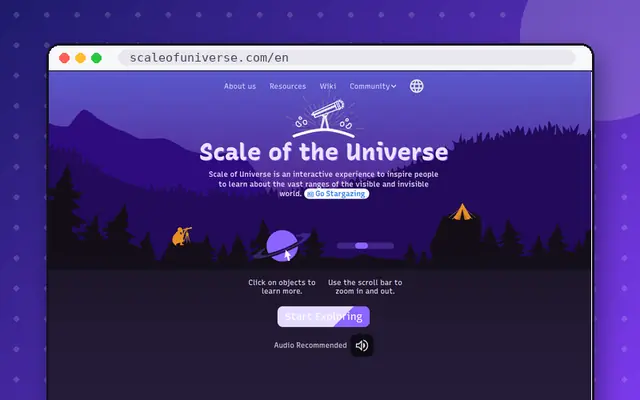
Zoom from quarks to the edge of the observable universe.
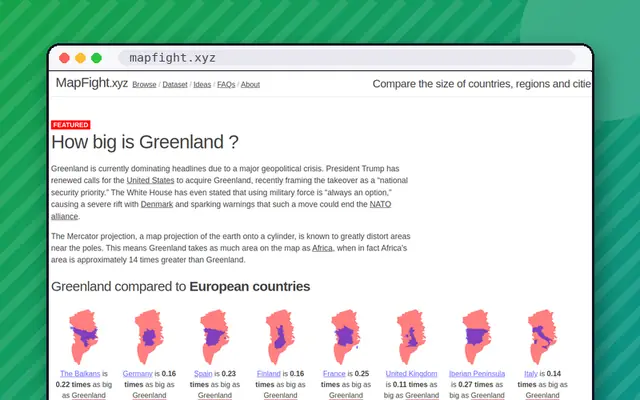
Drag countries around the map to see their real size.
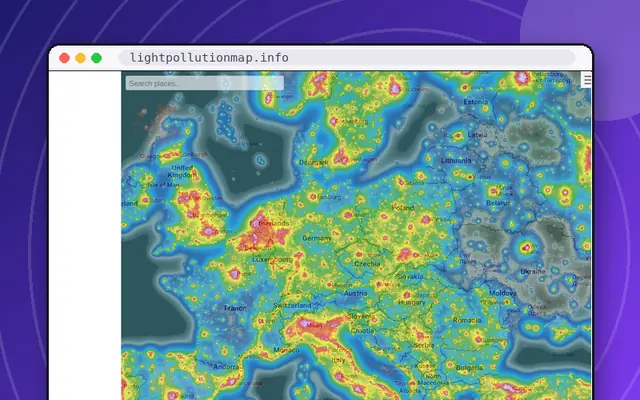
See how bright the night sky is where you live.
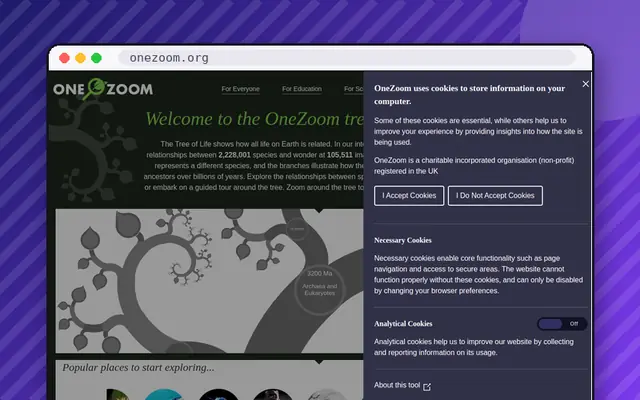
Zoom through the entire tree of life, from bacteria to blue whales.
See exactly where the International Space Station is right now.
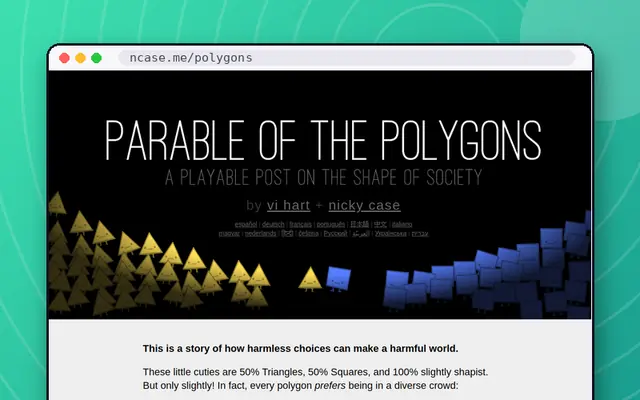
A playable post on how small biases build segregated societies.
Blow $100 billion on everything from Big Macs to an NBA team.
Long, gorgeous interactive essays on how things work.
A scatter map of thousands of music genres, with samples.
A playable guide to how ideas and behaviour spread through crowds.
Interactive explanations of ideas like Markov chains and eigenvectors.
An interactive guide to voting systems and why they matter.
An interactive timeline of all of history, powered by Wikipedia.
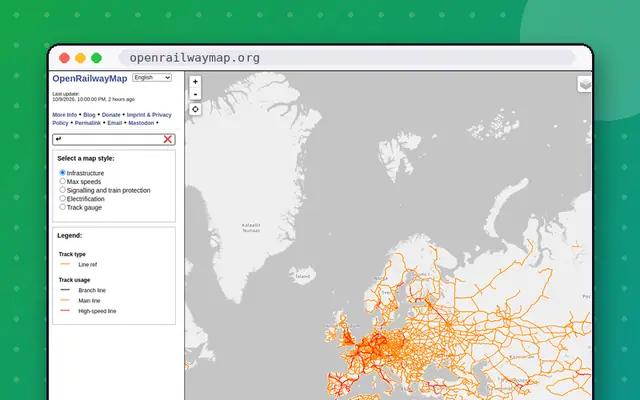
A world map of train tracks, signals and rail infrastructure.
The original Flash-era zoom through everything, rebuilt for HTML5.
Our World in Data, Gapminder Tools, The Pudding and Information is Beautiful are good starting points for statistics and design. For live data, try earth, Windy, LightningMaps and the USGS earthquake map. All are free to explore, and all are checked daily.
Live counters such as Worldometer and Internet Live Stats are statistical estimates, not exact counts. They are driven by models and published rates. They are great for building intuition about scale, but you should not cite them as precise figures without checking their stated sources.
earth by Cameron Beccario and Windy both animate wind, waves and weather on a zoomable globe. earth is minimalist and elegant, while Windy has a larger menu of layers. Both update from forecast data, and both are listed in this directory.
Our World in Data and Gapminder Tools focus on long-term trends and often show surprising progress alongside problems. Histography and Google Ngram Viewer are lighter, playing with time and language. Reading the underlying data yourself is the best way to form your own view.