
Our World in Data is a research publication that turns big global questions into interactive charts. Topics include poverty, health, energy, population, food and climate. Every chart can be explored by country, changed over time and downloaded, and the text around it explains where the numbers come from.
Its quiet superpower is perspective. Charts often show long-run trends, and many show things getting better in ways that headlines miss, alongside problems that are still serious. It is a good antidote to doom-scrolling without pretending that the problems are solved.
The project was founded by Max Roser at the University of Oxford and is run as a nonprofit. It works on phones and desktops. Go in with a question, such as how life expectancy has changed, and follow the charts. Related: /site/gapminder-tools, /category/data-viz.
Tips for getting the most out of it
- Start with a question you actually wonder about.
- Use the country selector and timeline to compare places.
- Download or share a chart when you need it.
Questions about Our World in Data
What is Our World in Data?
Our World in Data is a publication of interactive charts and research on global topics such as health, poverty, energy and population. Plan on plenty of time, since it is a genuine rabbit hole. It works on phones. You can find it at ourworldindata.org, and we check the link daily.
Who runs Our World in Data?
It was founded by Max Roser at the University of Oxford. It is run as a nonprofit research and publishing project. Plan on plenty of time, since it is a genuine rabbit hole. It works on phones. You can find it at ourworldindata.org, and we check the link daily.
Sites like Our World in Data

Gapminder Tools
Animated bubble charts that bust myths about the world.
- Rabbit hole
- Works on phones
- Alive · checked 17 days ago

Worldometer
Real-time counters for population, births, deaths and more.
- 5 minutes
- Works on phones
- Alive · checked 17 days ago

The Pudding
Visual essays that explain culture with data.
- Rabbit hole
- Works on phones
- Alive · checked 17 days ago

Explained Visually
Interactive explanations of ideas like Markov chains and eigenvectors.
- Rabbit hole
- Works on phones
- Alive · checked 17 days ago
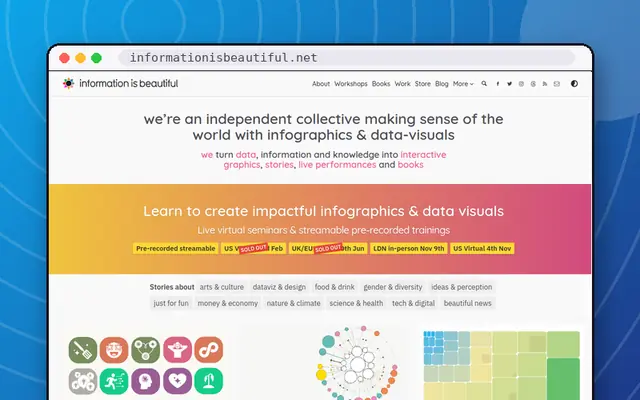
Information is Beautiful
David McCandless's gorgeous data visualisations.
- Rabbit hole
- Works on phones
- Alive · checked 17 days ago

Internet Live Stats
Real-time counts of emails sent, tweets posted and sites online.
- 5 minutes
- Works on phones
- Alive · checked 17 days ago