
This is a data-driven film about the human cost of the Second World War. Over about 18 minutes, stacks of figures and animated charts stand in for the soldiers and civilians who died, country by country, and the scale lands in a way a single number never does. An original score by Andy Dollerson plays underneath.
The interactive version follows a narrated path but stops at key moments and lets you step into the charts to explore them. The last segment widens out to the decades since the war and the long decline in battle deaths, drawing on data from the Uppsala Conflict Data Program and ideas from Steven Pinker's The Better Angels of Our Nature. It was released in 2015 and is widely used in classrooms.
It is sobering rather than fun, so pick your moment. The site says the interactive film runs best on a computer, and offers a YouTube version for phones and TVs. Neil Halloran has made other films in the same style; for more history told with data, try /site/histography or /category/data-viz.
Tips for getting the most out of it
- Watch the interactive version on a computer, with sound on.
- Set aside about 20 minutes; it is a film, not a toy.
- On a phone, use the YouTube version linked on the opening screen.
Questions about The Fallen of World War II
What is The Fallen of World War II?
It is an 18-minute interactive data documentary by Neil Halloran about the human cost of World War II and the decline in battle deaths since. Charts and visualizations tell the story, and the film pauses so viewers can explore the numbers.
Does The Fallen of World War II work on a phone?
The interactive version is best on a computer. On phones and tablets, the site recommends the video version on YouTube, which you can reach from the opening screen.
Sites like The Fallen of World War II

Gapminder Tools
Animated bubble charts that bust myths about the world.
- Rabbit hole
- Works on phones
- Alive · checked 29 days ago

Our World in Data
Charts on how the world is changing, with the data behind them.
- Rabbit hole
- Works on phones
- Alive · checked 29 days ago

Worldometer
Real-time counters for population, births, deaths and more.
- 5 minutes
- Works on phones
- Alive · checked 29 days ago

Explained Visually
Interactive explanations of ideas like Markov chains and eigenvectors.
- Rabbit hole
- Works on phones
- Alive · checked 29 days ago
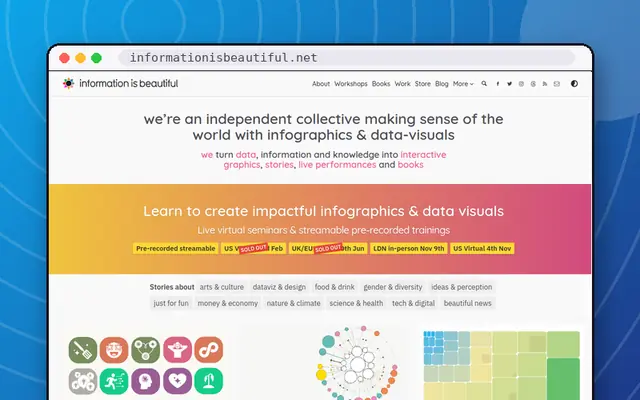
Information is Beautiful
David McCandless's gorgeous data visualisations.
- Rabbit hole
- Works on phones
- Alive · checked 29 days ago

The Pudding
Visual essays that explain culture with data.
- Rabbit hole
- Works on phones
- Alive · checked 29 days ago